|
|
|
METHODOLOGY TO UNDERSTAND THE ROLE OF KNOWLEDGE MANAGEMENT IN LOGISTICS COMPANIES Gaby Neumann, Daniela Düring ABSTRACT The role of knowledge as a strategic resource is well accepted in logistics companies. Nevertheless, the question of how to best make use of it still remains unanswered. A decade ago when knowledge management mainly has been seen as a matter of introducing information technology, knowledge databases and intranet solutions into companies, it had lost a lot of its credibility also in the logistics practice. As a result, there is just a slack implementation of knowledge management in logistics companies. To overcome this, knowledge management needs to be seen as a supporting service addressing a company's personnel, organisation and IT basis at the same time. Any knowledge management activity and investment into knowledge must aim to purposefully intervene in a company's logistics processes. For this, a methodology for qualitatively assessing and quantitatively measuring significant target variables, i.e. logistics key performance indicators, is required. Furthermore, valid models are needed to evaluate knowledge management interventions according to their effectiveness and to directly control those change processes. Against this background, the paper explains Vester's sensitivity analysis by applying it to the field of logistics knowledge management. More particularly, a first feasibility study is run to clarify whether a valid sensitivity model can be derived to allow a systematic simulation-based analysis for understanding the role of knowledge management in logistics companies and for identifying the impact of investments into knowledge on a company's (logistics) performance.
MOTIVATION AND INTRODUCTION Today's logistics processes and systems are characterised by an increasing level of complexity and complicatedness as well as the need for global networking to cope with the growing diversity of logistics problems. Because of this, knowledge is more and more becoming a competitive strategic resource in logistics, too. Consequently, activities dedicated to the management of this resource are linked with high expectations in the companies:
As a consequence, knowledge management is expected to provide a tremendous contribution to the improvement of logistics planning and performance. But despite of this common understanding, it has not yet been implemented in logistics companies or departments in large scale. Although Baumgarten and Thoms (2002) were able to identify even logistics knowledge management champions (with special focus on those companies involved in supply chain networks), they also had to recognize severe challenges in implementing knowledge management and running it in the daily logistics business. Major problems were seen in financial limitations, time restrictions, insufficient structuring and presentation of knowledge, as well as methodical misconceptions. Further reasons for acceptance problems and the slack implementation of knowledge management into logistics planning, operation and management are existing deficits in measuring the economic success of knowledge management initiatives (see Neumann and Tomé 2005). To contribute to current research in this area an empirical impact study has been run to (i) understand the current state-of-implementation of KM in logistics companies, (ii) identify general and company-specific needs for KM activities, and (iii) develop a model and methodology for specifying (or even better quantifying) the impact of KM on a company's economic performance. This study was based upon a questionnaire and impact model as explained by Neumann and Tomé (2005). In order to eventually detect cultural influences, the study was less focussed on global players and more centred on companies with a strong orientation towards regional and national markets. This approach was also supported by providing the questionnaire to the companies in the respective local languages. Altogether, 67 logistics companies from Germany, Portugal, Latvia, Poland and the Ukraine responded in the course of the study so far. The results as presented by Neumann and Tomé (2007) show a number of cultural or much more economically influenced differences between the levels of knowledge management maturity in logistics companies from different European regions as well as some clear differences between the individual knowledge management activities according to investment levels, priorities and needs for investments. Summarizing the findings, the main conclusion is that knowledge management still seems to be just of little importance in the logistics sector:
These results and findings of the study are in clear contrast to theoretical expectations about knowledge management providing a tremendous contribution to the improvement of logistics planning and performance. However, all of the responding companies considered knowledge extremely important. They also showed a strong interest in learning about and from the outcomes of the study. This indicates that despite of all the disillusionment that global empirical findings provoke, the role of knowledge and the fact that application of knowledge management can bring some good effects are indisputable. The problem simply seems to be a lack of knowledge and understanding with the companies on how to implement knowledge management methods in a customized way. The fact that, for example, intellectual capital reports are seldom produced or even unknown at all, serves as indicator of this statement. Even more, scientific literature spends lots of space on the discussion precisely about the evaluation of knowledge management projects and the economic assessment of a company's Intellectual Capital (North and Hornung 2003; North, Reinhardt and Schmidt 2004). But models used are not appropriate to quantify the impact of knowledge management on a company's (logistics) performance. Therefore, Neumann and Tomé (2005) extended the questionnaire by a set of 32 company performance indicators from seven areas: economic indicators, human relations within the company, customers, company operations, personnel, production processes, and strategy. Using these indicators companies characterized their performance before and after the investments into knowledge. For deriving the impact of knowledge-related investments on a company's performance Neumann and Tomé (2005) introduced a rather simple equation instead of the much more complex formulas provided by literature (e. g. Heckman et al. 1999): Y = aX +bKM + e (1) Here, Y represents the outcomes, KM the investment variables (the tool), and X the controls. The controls would be related to sectors, quality of human capital and other relevant characteristics of the company. The impact of knowledge management would be defined by b. Finally, variable a represents a set of coefficients associated with controls and variable e corresponds to the statistical error and also to the non-observable variables. From applying this microeconomic impact model on the full set of available data a number of positive and negative knowledge management impacts could be derived (Tomé and Neumann 2007). But due to the small number of respondents this analysis is based upon, its findings cannot be considered statistically significant and the question to what extent knowledge management activities have an effect on a company's (logistics) performance still remains open. As previous experiences show, the database gained from direct company input can only be extended to a volume necessary for delivering reliable, valid results when spending excessive efforts. Therefore, another methodological approach, a sampling-based sensitivity analysis, should be investigated to eventually build a sustainable knowledge management impact model in the form of a sensitivity model as basis for simulation-based investigation rather than an empirical study. SENSITIVITY ANALYSIS BY VESTER The sensitivity model is a trans-disciplinary modelling approach (SGZZ 2006). It has been developed by Frederic Vester as an attempt to assist groups of experts from different reality domains to build a common language as opposed to the prevalent jargons of specific areas of expertise (Vester 1999). The sensitivity model is based on the fundamental assumption that human cognition can best be described by activities of "pattern recognition". In other words, it follows the guideline that in modelling processes it is more important to "be roughly right than precisely wrong" (A. Einstein).
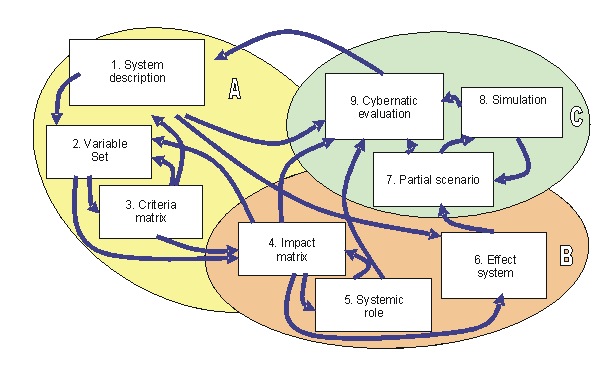
Vester's methodology guides the decision maker (problem solver) through a structured set of nine methodical steps for comprehensive construction and analysis of models based on circular causal logic (see Figure 1). From a methodological point of view, the sensitivity model represents a coherent integration of various techniques (cognitive mapping, feedback diagrams, cross-impact-analysis, and system dynamics simulation); the interdependent steps of this modelling procedure form parts of a recurrent routine: they are reiterated several times and thus determine their results mutually. More generally, Vester's sensitivity analysis is a method of networked thinking, giving support to the analysis of complex problems (Vester 2000). It is characterized by the underlying biocybernetic view looking at the system as a living structure. Application areas range from city and regional planning over ecology to business strategies. A well-known application example is the biocybernetic adaptive modelling of corporate networks by Engelbrecht. He shows, that companies are components of a complex impact structure of various influences, and helps them understand and use for a targeted and proactive work in corporate networks (Engelbrecht 2001). Three phases can be distinguished (see SGZZ 2006): The steps of "system description" and "set of variables" apply brainstorming techniques in order to develop a most diverse picture of the system under study and to catch all trends and aspects that are potentially relevant; it also helps building a common language between the participants (phase A: identify the system). "Systems criteria" and "cross-impact-matrix" steps focus on evaluating system relevance of the variables defined so far and on the direct interdependencies between them, respectively. Results of cross-impact analysis are presented in a "portfolio of variables" conceived for interpreting the cybernetic character of all variables. Next a "feedback diagram" is used to analyze the indirect causal loops which determine a system's behaviour (phase B: understand the system). Against this background "sub-systems" are developed to focus on particular issues in a more detailed manner. These sub-systems are simulated to explain the dynamics of the feedback structures which have been defined in the previous steps. In a final step, "bio cybernetic rules" are applied for a general assessment of the viability of the system being analyzed (phase C: influence the system). In the following sections, this method is applied to investigating and specifying the effectiveness and impart of knowledge management in logistics. Lessons learned and experiences obtained result in a critical appraisal. With this, the applicability of the sensitivity analysis method to the field of knowledge management is evaluated. Furthermore, eventually open issues and next steps on the road towards a qualitative as quantitative understanding of an effective and efficient knowledge management application to logistics companies are derived. SENSITIVITY ANALYSIS FOR KNOWLEDGE MANAGEMENT - IDENTIFY THE SYSTEM (PHASE A) In the first phase of the sensitivity analysis, a single picture of the system is developed to achieve a common basis for the subsequent steps. Originally and according to Vester's methodological approach the entire sensitivity analysis is usually carried out in the frame of a workshop - lasting several days - bringing together all relevant stakeholders of the system. The first phase usually begins with a brainstorming session in which all characteristic system components are collected (system description, step 1). Moreover, the system's boundaries with its environment are defined. Since we are aiming at verifying the suitability of the sensitivity analysis for being used in the field of knowledge management (feasibility study), this standard procedure is slightly modified in our investigation. Instead of a brainstorming session with several parties we rely on a singular expert opinion when describing the system and creating the set of variables. In simplified terms, it is assumed that the singular expert opinion already represents the consensus of several expert opinions as they would have been received from the brainstorming session.
The set of variables (step 2) is based on the same set of variables as questioned in the impact study presented above. These 32 microeconomic indicators (KPIs - Key Performance Indicators) from 7 groups form the internal variables that are describing the system (a profit-oriented company) according to the Balanced Scorecard approach (see Table 1). For determining the influence of knowledge management on the company and its performance, the 16 knowledge management activities from the questionnaire are used as external variables (external control lever), which intervene from the outside into the system and accordingly influence the events in the system (see Table 2).
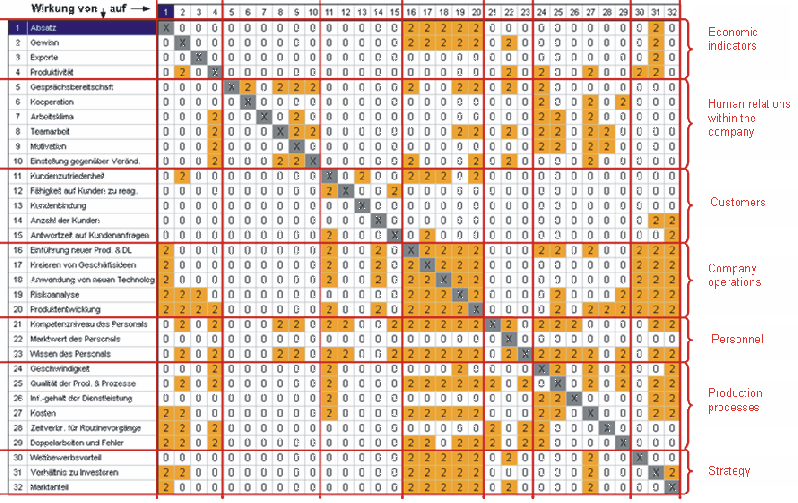
To complete phase A of the sensitivity analysis, the so-called criteria-matrix is to be developed (step 3). This matrix is used to evaluate the system components in terms of their relevance for the system (assessment of the completeness of the system description). But within the scope of this investigation, this step was disregarded - assuming that the above set of variables already fully describes the system. SENSITIVITY ANALYSIS FOR KNOWLEDGE MANAGEMENT - UNDERSTAND THE SYSTEM (PHASE B) The set of variables resulting from phase A serves as basis for the steps of phase B. First (step 4), the influences of the system components at each other (how does each internal variable affects each of the others) are evaluated by use of an impact matrix (see Figure 2).
To evaluate the mutual influences, the following four value system is used:
This qualitative specification of influences requires detailed knowledge about cause-effect chains and interdependencies in the system respectively. For the intended analysis of the principle suitability and practicality of the method in our application context, no detailed investigation of the impacts has been made. Instead, the scores of "no impact" (0) and "equivalent impact" (2) were assigned only. According to this, all existing effect relationships are assumed to show a proportional effort-benefit ratio. Out of this impact matrix four key figures are determined for each of the considered variables:
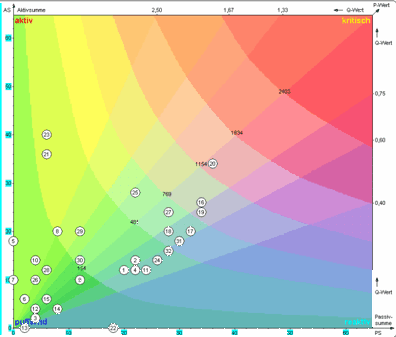
These key figures provide information about the role of a variable in the system (see Vester 2001). The product P reveals a variable as being strongly buffering, buffering, weakly buffering, neutral, slightly critical, critical or highly critical. Buffering or sluggish variables with P<(n-1)2 affect the other variables weakly only and are also very weakly influenced by them. Effects on these variables affect the system only little and often with large time delay. Furthermore, these variables remain relatively constant, even with greater changes in the overall constellation. In contrast to this, critical variables with P>(n-1)2 strongly affect other variables and the whole system, but are also easily influenced by them. Therefore, they can serve as a control lever to bring changes in motion even in deadlock situations. On the other hand they should be treated with caution, because otherwise developments may build up or overturn. The ratio Q reveals about a variable whether it is strongly reactive, reactive, slightly reactive, neutral, slightly active, active or highly active. A reactive (passive) variable with Q<1 strongly reacts on changes in the system even without leading to big changes. Such variables can excellently be used as indicators, although effects may occur with a large time lag or in extreme situations only. To change them by interventions this resembles a symptom treatment which seldom brings improvement for the overall constellation. Active variables with Q>1 have a stabilising effect because of their strong influences and rather weak interference. They cannot be used as control lever in the system, but they have a lasting impact on the system's behaviour when being changed intentionally or unintentionally by interventions from the outside. The combination of these two key figures P and Q is important for handling a variable. Even if two variables show a similar criticality (buffering vs. critical) both have to be treated differently because of their different level of activity (active vs. reactive). As example for this we use the variables "knowledge of personnel" (variable (23); AS=40; PS=6, P=240; Q=6.67) and "speed" of the production processes (variable (24); AS=14; PS=26, P=364, Q=0.54). Both variables are equally to be assessed buffering because their P-value is significantly smaller than (n-1)2=961. However, there are serious differences regarding their level of activity. Whilst "knowledge of personnel" shows a Q-value significantly larger than 1 and therefore can be assessed highly active, "speed" of the production processes has to be assessed reactive because of its Q-value clearly less than 1. All in all, Vester identifies 50 possible combinations of P and Q value ranges corresponding to 50 different roles. These can easily be taken from the so-called systemic role (step 5), since each role is displayed in a different colour shade (see Figure 3). For each role, there is a specific role-description which hints on how to deal with this variable in terms of its specific role in the system considered. For example, "knowledge of personnel" (variable 23) "is suitable as control lever re-stabilizing the system after any change if the correct approach to its operation is found (plastic stability)" (generated from the software tool "Sensitivity Model Prof. Vester"). In contrast to this the "speed" of the production processes (variable 24) is a "reactive variable that buffers influences by others without significantly influencing the system through its own changes - unless it has a specific impact on active or critical components. (This variable is) only partially suitable as an indicator" (generated from the software tool "Sensitivity Model Prof. Vester"). The roles of all variables specified in this way are to be tested for sensibility, i.e. whether a determined role conforms to the own expectations/ideas about the effect of a variable. In case of a conflict between systemic role and the own expectations, the respective variable with its effects need to be reviewed and modified in the impact matrix. Furthermore, control levers and indicators as well as critical and buffering variables are identified to get a clear understanding of the most promising variables to influence the system as intended or to achieve a defined target function. For the two variables used as examples the identified roles would be associated with the consequence that interference in the "knowledge of personnel", for example by training, would have a lasting positive effect on company processes whereas actions increasing the "speed" of the production processes only would be just of little effect and thus rather inefficient. These findings appear as plausible as valuable for a systematic intervention into the company structure and represent a first major result of the sensitivity analysis.
In total, 240 out of 1,024 possible effect relationships in the impact matrix had been defined "available" (see Figure 2). Because of this quantity which is barely manageable for modelling the system the idea of expanding Vester's methodology by aggregating variables. As basis the grouping of performance indicators (as internal variables) and knowledge management activities (as external variables) from the survey was used. There are different ways to aggregate variables and their influences described in the impact matrix:
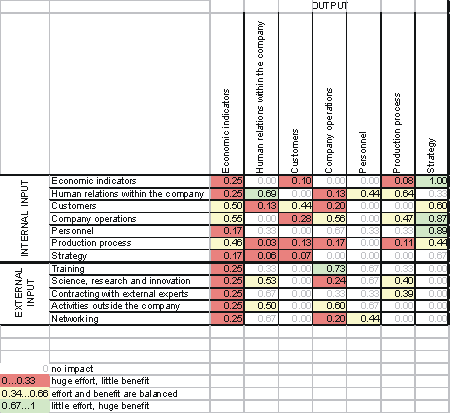
By aggregating the variables, the respective groups of influences are no longer represented as a set of individual relationships, but as one total impact in terms of a complex key figure. Which of the above mentioned key figures (and hence methods of aggregation) fit for this use, this always depends on the context the investigation is settled down in and the statement the aggregation should bring out. While the average value and degree of capacity exploitation do focus on the strength of the influences, the impact index reduces the individual influences to their number without considering the strengths of the individual influences. Therefore, the impact index provides information about the level-of-interdependence of the aggregated variable only. Since the intended system model should not only show the system in terms of its structure and complexity, but also allow analysing the impact transmission when being stimulated from the outside, the impact index is rather not suitable here. Instead, the degree of capacity exploitation will be used for aggregation, as it also reflects the composition of aggregated influences (see Figure 4).
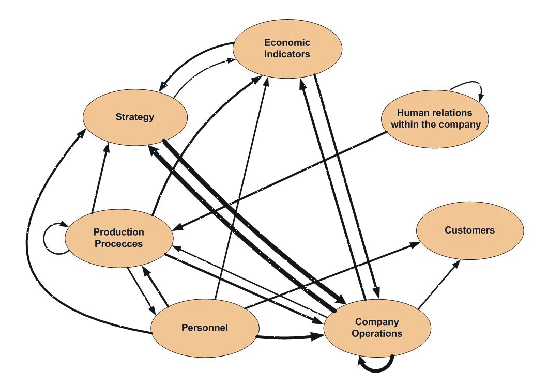
After creating the impact matrix of aggregated variables, the effect system can be created next (step 6). Here, the system components are interconnected. As basis, the values from the impact matrix are used with a focus on the most important influences, i.e. those of high and very high values, only. For the aggregation based on the degree of capacity exploitation (see Figure 4), effect relationships were defined strong, if their resulting impact figure was in the middle third (0.34 0.66) or in the upper third (0.67 1). Weak influences with a low degree of capacity exploitation (0 0.33) were disregarded for simplification reasons. The internal effect system determined this way (see Figure 5) represents the interferences within the company and can hypothetically be seen as a model for the way a profit-oriented company is supposed to work. Therefore, those company activities interacting with almost all other components seem to be the key components in the performance measurement system of a company. Consequently, areas like "strategy" and "economic indicators" are components mainly receiving effects and hence suitable for being a key figure for evaluating the system. On the other hand, "production processes" and "personnel" are areas sending out manifold effects. Therefore, they seem to be predestined as points of intervention for purposefully changing the system from the outside. "Human relations within the company" appear relatively separated from the rest of the system, so that influences on this area should not have any impact on the system as a whole.
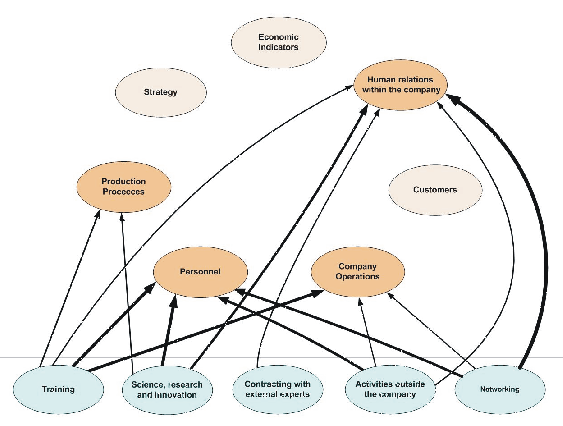
Generally, the effect relationships of the model determined in this way do not only describe the interactions of the aggregated variables, but also the paths through which the external impacts are passed on in the system. The purposeful investigation of such effect transmisions is subject to the third phase of the sensitivity analysis. SENSITIVITY ANALYSIS FOR KNOWLEDGE MANAGEMENT - INFLUENCE THE SYSTEM (PHASE C) The third phase of the sensitivity analysis (Vester calls it "rule the system".) aims to understand the consequences of external influences on system components. Here, the effectiveness of the different control levers is of special interest to be able to choose the most effective action. Criteria for this are the impact intensity, i.e. which effort (e.g. level of investment) leads to which benefit (target value of a performance indicator) or, in the other way round, which effort is required to achieve the intended benefit, and how long does it take until a control lever becomes effective with the respective performance indicator. In the study as presented, the effect system of performance indicators cannot be influenced by changing an indicator directly. Instead actions like e.g. knowledge management activities as investigated (see Table 2) are required that directly influence a particular element of the indicator system from the outside. To figure out which of these actions (external control levers) actually have a direct influence on the indicator system their impacts were evaluated analogous to the impact matrix of the internal relations. The (strong) relationships derived from this are again graphically visualized in an effect system (see Figure 6). This first of all shows (as expected) that knowledge management activities primarily affect at points where it is about people and their way of acting within the company. While direct influences on the areas of "personnel" and "human relations within the company" are the strongest, none of the control levers has a direct influence on the system components "strategy", "economic indicators" and "customers". If knowledge management activities are intended to initiate changes at these points, one can rely on indirect effects only which sooner or later will occur due to a strong internal interaction of system components (see Figure 5).
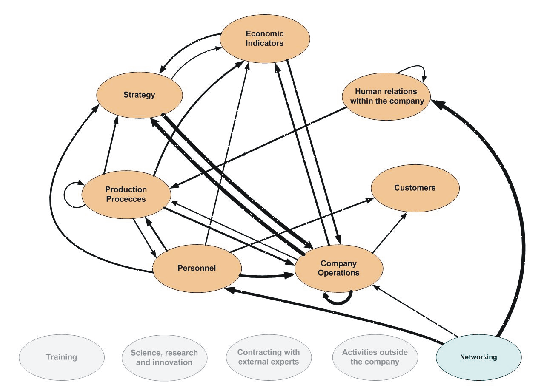
To be able to more clearly describe each of these effects in terms of both the time until they start impacting and the strength they achieve, the individual options for intervening and their respective effects are represented in separate sub-systems. These sub-systems contain influences by a single effective control lever only, but show all effects directly or indirectly resulting from its intervention. As example we now take a closer look at the sub-system "networking" since this complex of action appeared as one of the main fields of action in the survey (see Tomé and Neumann 2007), but showed the lowest active sum of all groups of activities in the impact matrix. This contradiction can partially be explained by interpreting the respective effect system (see Figure 7), which shows that increased networking activities affect the area of "human relations within the company" strongest. As this area - as discussed above - seems to be an almost irrelevant system component (see Figure 5), it can be assumed that the impacts from an increased networking effort fizzle out here. Similarly, the effects of "networking" efforts on "company operations" may not result in measurable benefits to the system as a whole although the key component of the system would directly be affected and this implies short effect paths and thus a quick impact transmission. But as the direct impact of "networking" is pretty weak, significant impacts on the system as a whole can hardly be expected here, too. For this reason, it can be assumed that "networking" actually influences the company by affecting the "personnel" only. This are is one of the most active ones in the system; the direct effects of "networking" on this complex of indicators are relatively strong and can spread out to almost any other area. Nevertheless, the indirect and rather long transmission paths might probably lead to a relatively slow transmission and delayed appearance of measurable impacts.
In a similar way, further options to influence the system (control levers) would have to be investigated now to identify the most promising activities for achieving a particular change of the system from a before and after comparison. On the other hand, the strength of the effects and the time until they appear could be derived by use of simulation. In the end, possible options of investments in knowledge or knowledge management can comparatively be analysed in terms of their company-specific impacts and with respect to their contribution to achieving a defined level of improvement in relation to the respective need for investments. However, a serious prerequisite for such findings is in any case a valid model of both the internal effect relationships and the mode of action of external control levers. CRITICAL REVIEW OF THE RESULTS The initial results obtained so far from applying Vester's methodology of a sensitivity analysis support the assumption that this way it is possible to analyze, understand and model the impact knowledge management in logistics companies. At the same time, it must also be emphasized that the state of knowledge reached is based on a number of simplifications regarding both the problem description and the application of the method. This is to question and eventually even to be adapted. A first point of criticism is related to the indicators used for measuring a company's performance. These were taken as examples from the Balanced Scorecard and are now to be evaluated with regard to their appropriateness and completeness for creating a complex company model such as the effect system shown in Figure 5. In particular, it seems appropriate to add logistics-related KPIs to those general company performance measures as used so far to specifically investigate the impact of knowledge management activities on logistics. Additionally, further approaches found in the current literature (e.g. Economic Value Added or Logistics Service Level Agreements) might provide objectified and practically relevant target variables for influencing the effect system. Economic Value Added (EVA), for example, stands for a value-oriented manage-ment. Hereunder, Binner (2002) understands the value-oriented thinking and acting that is to be implemented overall business areas, functions and hierarchies by any executive manager for each employee with the long-term aim of increasing the company's value. Thus, EVA forms the framework for implementing a general management strategy, whereby the overall strategic area of success orientation can only be reached by impacting on the strategic areas of customer focus, employee orientation and process orientation. This holistic way of thinking should also be kept in mind for an impact analysis of knowledge management when finally developing a complete model of direct and indirect influences and their spread-out in the indicator system of a company. In the previous investigation just those structural and performance data as well as the company indicator system were exclusively related to general business and process targets. Because of this, the current company sensitivity model is also of rather general nature. Extending the set of variables by - as already mentioned - typical logistics indicators and aggregating them in terms of content to groups of variables or complex key figures - this forms the basis for modifying the general effect system towards a more logistics-specific one. For this, it is also necessary to identify the most appropriate, concrete and informative method for aggregating variables and give proof of its validity. To determine and evaluate the mutual influences of internal variables and to specify points of intervention of external variables (including their level of impact) a singular expert opinion and simplistic assumptions were used as basis so far. In accordance with the methodology by Vester this necessarily has to be replaced by a consensus impact matrix with differentiated impact assessments. Corresponding input information can be obtained, for example, by an individual questioning of various experts (e.g. CEO, commercial manager, technical manager, logistics manager, personnel manager) first from one company and later being followed by those of various companies. Within expert workshops these information can be discussed in order to achieve a consensus. This would also eliminate the subjectivity of the previous assessments (especially in the impact matrix). Generally, it is to state that even a valid sensitivity model cannot be used to determine reliable quantitative statements about the consequences of a certain investment in knowledge management in terms of the resulting value of a specific performance indicator. Instead, the model allows targeted experiments with the effect variables (i.e. the effort in particular knowledge management activities) to systematically investigate and qualitatively assess the impact on certain target variables and specific groups of indicators. This aims at purposefully controlling the interventions into a company's knowledge processes and spending related efforts in an efficient manner. However, the aim does not consist in concretely determine the return-on-investment of a certain knowledge-oriented investment. Here, an essential, idealising basic assumption is that any impact of change within the internal effect system of the company can solely be achieved by knowledge management activities. There are no feedback loops between internal variables and those external factors; the latter are used as outer, active control levers only. Investigating possible feedback loops inside the effect system was neither done nor intended. SUMMARY The paper has presented a feasibility study on the applicability of a sensitivity analysis according to Frederic Vester for modelling the impact of knowledge management in logistics companies and discussed the relevance of results achievable from this. This method is typically known from analysing a complex system dynamic context. Therefore, it was to be clarified whether it can be applied to analysing the impact of knowledge management in principle and if a viable and valid sensitivity model can be obtained. Such a model might then form the basis for systematic simulation studies to quantify and qualify the control lever function and the impact of investments related to knowledge management on the logistics performance of a company respectively. As a result, these questions can clearly be answered positive. Application of a sensitivity analysis seems to be a promising way to understand the effects of knowledge management in a particular company context and to determine the specific impact of knowledge management activities on company processes and performance indicators. Although a valid sensitivity model of knowledge management effects is still under development, first experiments already demonstrated which performance indicators are actually directly or indirectly affected by a certain knowledge management activity. Moreover, interesting discussions were initiated with practitioners who suddenly look at "their dynamic system" from a fully new perspective. Based upon our current findings next steps aim to evaluate performance indicators and extend them by logistics-related indicators. Furthermore, a suitable method for a correct and meaningful aggregation of elementary effect relationships is to be identified. In addition to this, the interim sensitivity model is to be revised and to be validated according to discussions with company experts. Finally, the cybernetic roles of the different variables in the model are to be compared to the results of the empirical study with respect to investments in, priorities of and needs for knowledge management activities to derive suitable guidelines for the companies. REFERENCES Baumgarten H., Thoms J., 2002, Trends und Strategien in der Logistik: Supply Chains im Wandel, Berlin. (Trends and strategies in logistics: supply chains in the change, in German) Binner H.F., 2002, Unternehmensübergreifendes Logistikmanagement, Hanser: München. (Logistics management across companies, in German) Engelbrecht A., 2001, Biokybernetische Modellierung adaptiver Unternehmensnetzwerke, Düsseldorf. (Bio-cybernetic modelling of adaptive company networks, in German) Heckman J., Smith J., Lalonde R., 1999, The economics and econometrics of Active Labour Market Programs; O.Ashenfelter and R.Lalonde (eds), Handbook of Labour Economics, vol 3A, chapter 31, North Holland, 1865-2097. Neumann G., Tomé E., 2005, Knowledge Management and Logistics: An Empirical Evaluation; Proc. I-KNOW'05 - 5th International Conference on Knowledge Management; Graz (Austria), June 29-July 1, 96-103. North K., Hornung T., 2003, The Benefits of Knowledge Management - Results of the German Award "Knowledge Manager 2002"; Proc. I-KNOW'03 - 3rd International Conference on Knowledge Management; Graz (Austria), July 2-4, 302-310. North, K., Reinhardt R., Schmidt A., 2004, The Benefits of Knowledge Management: Some Empirical Evidence; Proc. The Fifth European Conference on Organizational Knowledge, Learning and Capabilities; Innsbruck. SGZZ - St. Gallen Zentrum für Zukunftsforschung, 2006. Welcome to the Future - Systems Thinking Practice - Sensitivity Model. [on-line] http://www.sgzz.ch. Tomé E., Neumann G., 2007, Knowledge Management and Logistics: A European Perspective, Martin B., Remenyi D., (eds.), The 8th European Conference on Knowledge Management, vol. 2, Barcelona (Spain), September 6-7, 1009-1016. Vester F., 2000, Die Kunst vernetzt zu denken - Ideen und Werkzeuge für einen neuen Umgang mit Komplexität, Stuttgart 2002 (The art of networked thinking - ideas and tools for a new approach to complexity; in German) Vester F., 2001, Methodenhandbuch Sensitivitätsmodell Prof. VesterŽ; München 2001 (Methodical handbook on the sensitivity model by Prof. Vester, in German). Vester F., 2007, Projects applying the Sensitivity Model Prof. VesterŽ, [on-line] http://www.frederic-vester.de/deu/sensitivitaetsmodell/publikationen-projekte/ (August 25, 2007). METODOLOGIA POZNANIA ROLI ZARZĄDZANIA WIEDZĄ W PRZEDSIĘBIORSTWACH LOGISTYCZNYCH
STRESZCZENIE Rola wiedzy jako czynnika o znaczeniu strategicznym jest szeroko akceptowana wśród przedsiębiorstw logistycznych. Aczkolwiek nadal otwarte jest pytanie, jak najlepiej wykorzystać te zasoby. W latach 90-tych, gdy zarządzanie wiedzą ograniczało się głównie do wprowadzania technologii komputerowych, baz danych oraz rozwiązań opartych na sieciach intranetowych, również w obszarze logistyki stracono dużo z potencjalnych korzyści w tej dziedzinie. W efekcie obserwuje się braki we wprowadzaniu zarządzania wiedzą w przedsiębiorstwach logistycznych. Aby pokonać to, należy traktować zarządzanie wiedzą tak samo jak wspomaganie zarządzaniem kadrą, organizacją oraz strukturami IT i powinno być dokonywane w tym samym czasie. METHODISCHER ANSATZ ZUM IDENTIFIZIEREN DER ROLLE DES WISSENSMANAGEMENT IN LOGISTIKUNTERNEHMEN
ZUSAMMENFASSUNG. Auch in Logistikunternehmen ist die Rolle von Wissen als strategische Ressource akzeptiert. Nichtsdestotrotz ist die Frage nach seiner bestmöglichen Nutzung noch immer nicht ausreichend beantwortet. In den 1990er Jahren, als Wissensmanagement vornehmlich als ein Problem der Einführung von Informationstechnologie, Wissensdatenbanken und Intranetlösungen in die Unternehmen angesehen wurde, hat es auch in der Logistikpraxis einen Großteil seiner Glaubwürdigkeit verloren. Dementsprechend ist bis heute nur eine zögerliche Implementation von Wissensmanagement in den Logistikunternehmen zu beobachten. Um dies zu verändern, muss Wissensmanagement vielmehr als unterstützenden Service betrachtet werden, der gleichzeitig auf die personelle, organisationale und informationstechnische Basis des Unternehmens ausgerichtet ist. Jede Wissensmanagementaktivität und jede Investition in Wissen muss auf das zielgerichtete Einwirken auf die Logistikprozesse eines Unternehmens ausgerichtet sein. Voraussetzung hierfür ist eine geeignete Methodik zur qualitativen Bewertung und quantitativen Messung signifikanter Zielgrößen, also der logistischen Schlüsselkennzahlen. Desweiteren sind valide Modelle für die Evaluation der Effektivität von Wissensmanagement-Interventionen sowie für die unmittelbare Führung und Steuerung solcher Veränderungsprozesse erforderlich. Vor diesem Hintergrund stellt der Beitrag die Methode der Sensitivitätsanalyse nach Vester vor und diskutiert ihre Anwendung im Bereich des Logistik-Wissensmanagement sowie die Aussagekraft der Ergebnisse im Rahmen einer ersten Machbarkeitsstudie. Insbesondere wird geklärt, ob sich aus der Methodenanwendung ein valides Sensitivitätsmodell als Basis für systematische Simulationsuntersuchungen zur Qualifizierung und Quantifizierung der Stellhebelfunktion bzw. Wirkung wissensmanagementbezogener Investitionen auf die Leistungsfähigkeit eines (Logistik-)Unternehmens ableiten lässt.
Gaby Neumann |
Copyright © 2005 LogForum, Wyższa Szkoła Logistyki, ul.E.Estkowskiego 6, tel. 061 852 95 55, 851 06 04, tel./fax. 061 851 06 03 |

